COVID-19 in Iceland
A prediction model for the number of individuals diagnosed with COVID-19 and the corresponding burden on the health care system.
2020-05-04
Summary
This will be the last prediction for the current wave of the COVID-19 epidemic in Iceland. The research team will continue to monitor and evaluate whether it’s timely to resume predictions later on. It’s possible to monitor the development of new infections in Iceland, in addition to everywhere else, at the University of Iceland’s Health Sciences’ dashboard, available here.
To use the dashboard, you must first turn it on by pressing the “Birta (publish)” button. You can then add countries for comparison. For example:
- You can view the total number of infections on two different scales; clean numbers (or what’s called a linear scale) or the logit of the numbers. The logit is useful for comparison of the growth rate. Fixed relative growth then follows a straight line.
- The trend can be checked by date or number of days based on a given condition (such as the number of diagnosed infections exceeding one hundred).
Today, there are 66 active infections. On March 9, the number of active infections was similar (68). One week later, the number had tripled and it took six weeks of strict social distancing to curb the epidemic. So it’s vital to maintain the progress we’ve made, install the tracking app on phones and encourage others to do the same. Do not hesitate to get tested by your health care provider if the slightest suspicion of infection arises.
The main results of the prediction model, with data through 3rd of May, are as follows:
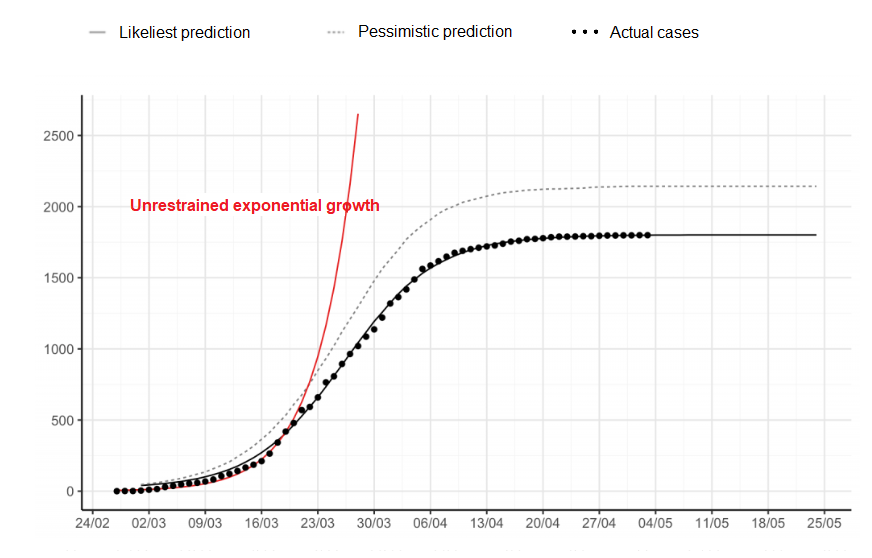
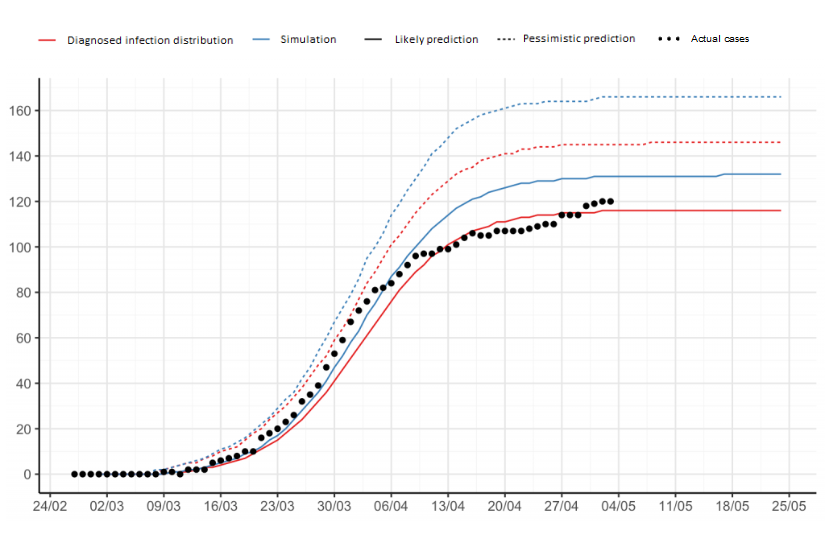
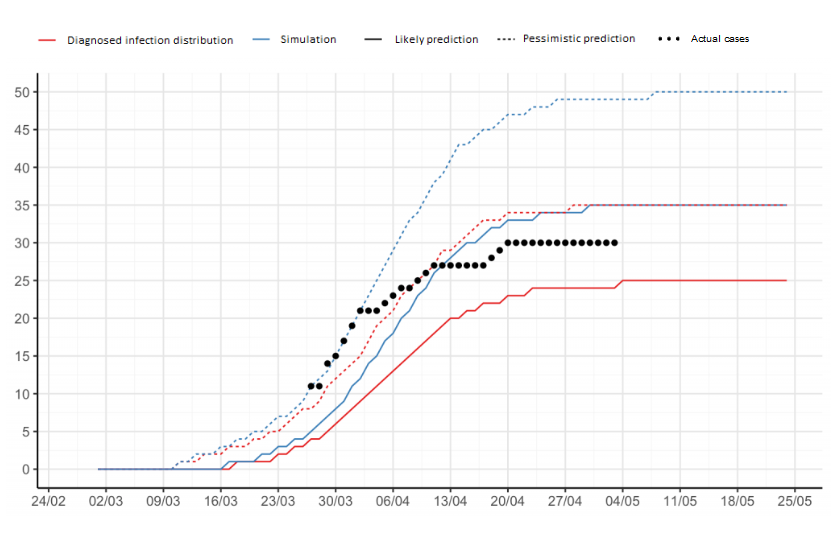
- It is expected that throughout the epidemic, about 1800 individuals in Iceland will have been diagnosed with COVID-19, but the number could reach as high as 2100 individuals, according to the pessimistic forecast.
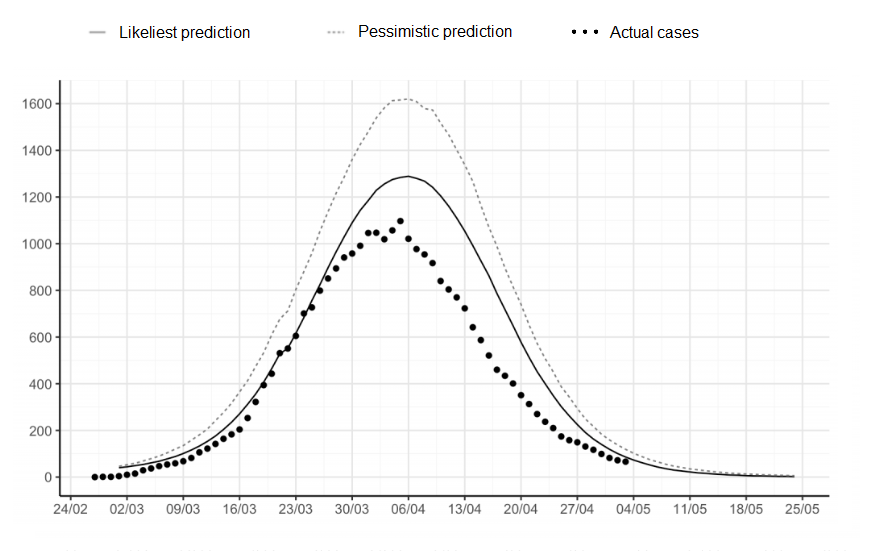
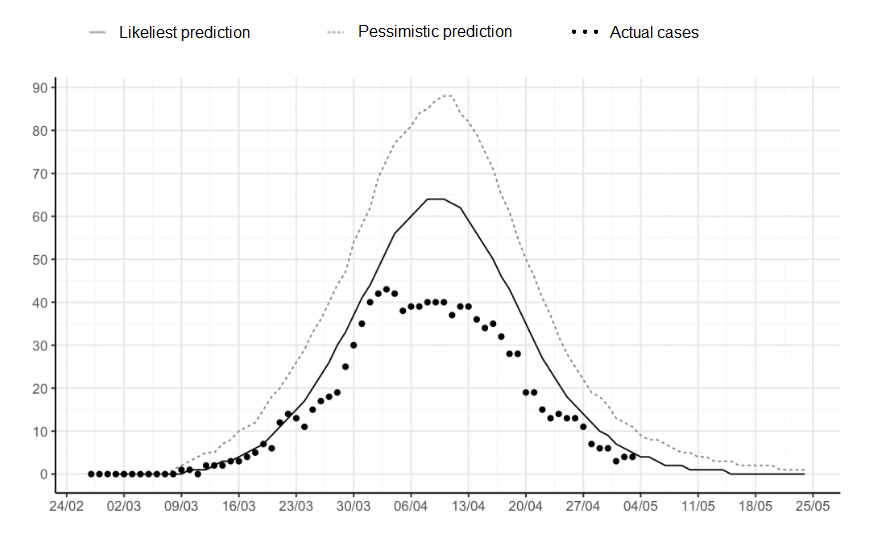
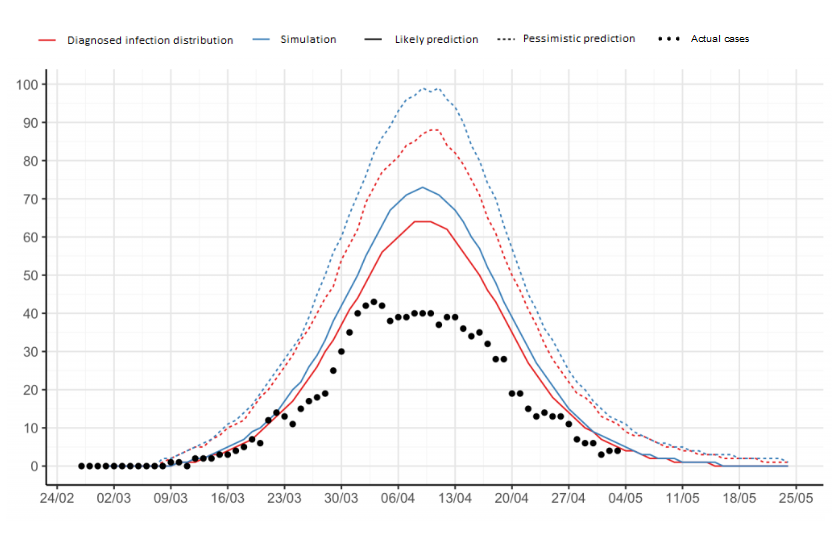
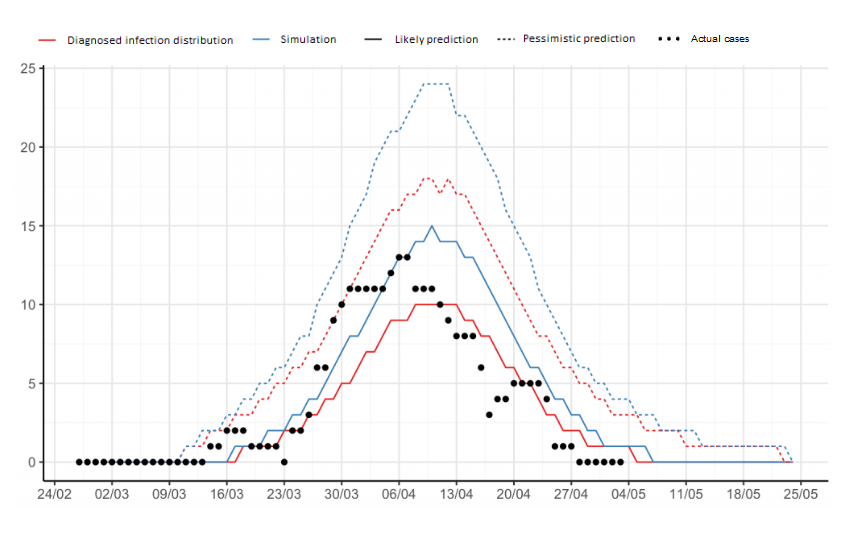
- It is expected that the number of diagnosed individuals with an active disease peaks in the first week of April and will at that time probably be about 1300, but could be as many as 1600 individuals in the week after, according to the pessimistic forecast.
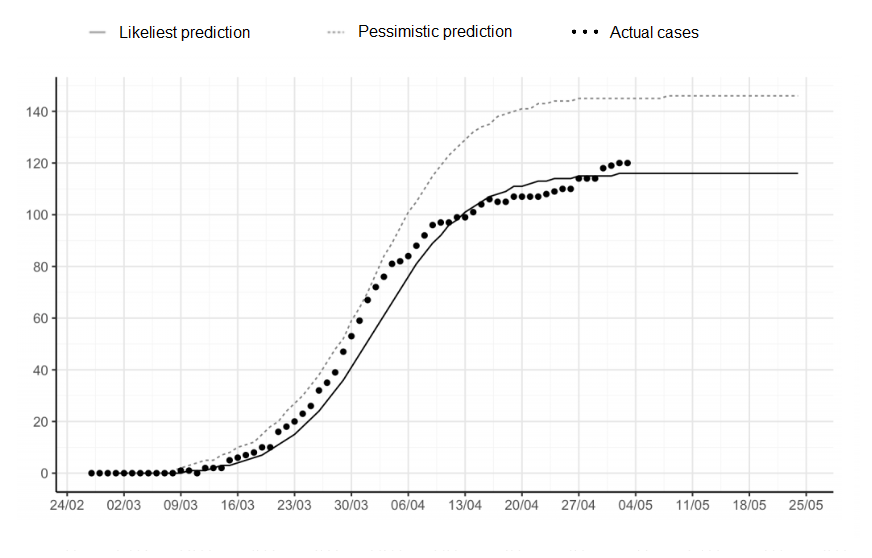
- It is expected that while the epidemic is ongoing, about 120 individuals will need hospitalization but this number might reach 150 according to the pessimistic forecast.
- The greatest burden on health care services due to hospital admissions will be around mid-April. At that time it is expected that around 60 individuals will be hospitalized but the pessimistic forecast predicts 90 individuals.
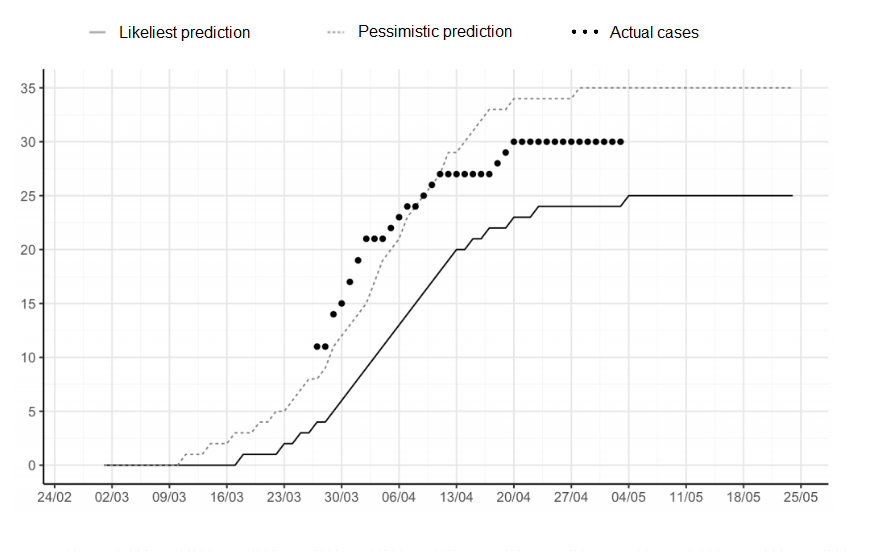
- It is expected that during the epidemic, approximately 25 individuals will become seriously ill (i.e. hospitalized in intensive care units), but this number might turn out to be as high as 35, according to the pessimistic forecast.
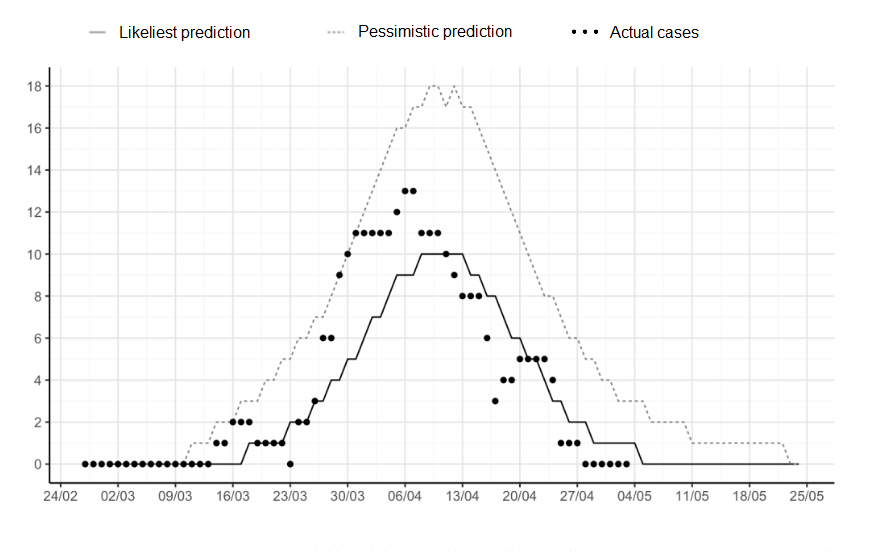
- The heaviest burden on intensive care units is likely to be in the second week of April, when 10 COVID-19 patients are anticipated to need intensive care at the same time, or even 18 according to the pessimistic forecast.
-
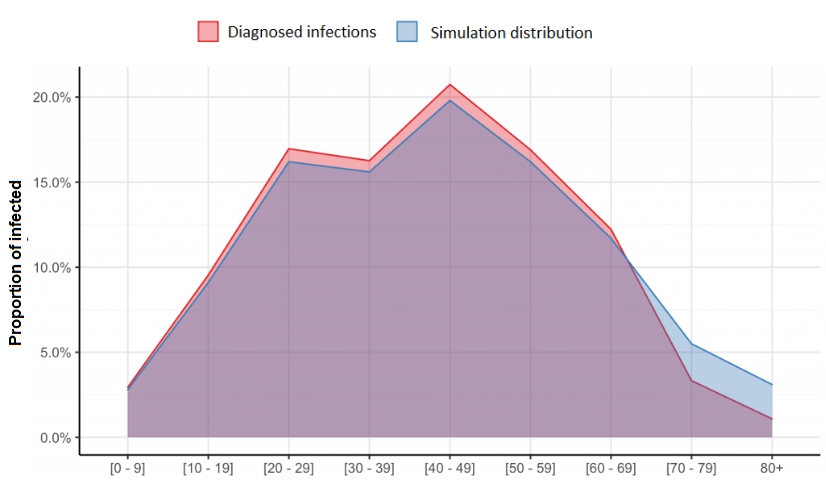
- Age distribution changing towards more diagnosed infections among individuals over the age of sixty would significantly increase the burden on health care.
It is necessary to keep in mind that as Iceland‘s population is small (about 360.000) the number of confirmed cases can vary greatly from day to day, which will affect the results of the prediction model. The model will, though, become more stable as time passes.
Methods and premises of the prediction model
We used a logistic growth model with negative binomial distribution for the number of COVID-19 infections diagnosed daily in Iceland to predict the median (likeliest prediction) and 97.5% upper limit (pessimistic prediction) of the cumulative number of confirmed COVID-19 cases in Iceland and active diagnosed cases (assuming 21 days of illness) in the upcoming weeks.
- The epidemic prediction model assumes exponential growth of diagnosed infections to slow down at a certain point, as the epidemic reaches its peak and the number of new infections starts to decline and the number of active infections subsequently starts to decline.
- The calculation method used to assess the shape of the growth curve in Iceland takes into account information on COVID-19 epidemic processes in other countries (see annex) to estimate the possible shape of the process in Iceland. Countries that have progressed further in the epidemic, e.g. South Korea, weigh more than the ones not as far into it.
- Since all infected individuals in Iceland are clients of the Icelandic health care system, the forecast is based on the total number of infected individuals in Iceland, regardless of the source of infection, whether individuals are diagnosed in quarantine or not, whether they are diagnosed through the screening through the healthcare services or deCODE genetics. It should be kept in mind that infected individuals in quarantine may possibly add less to the exponential growth than other individuals.
- We used the age distribution of already confirmed COVID-19 cases in Iceland to estimate the distribution of future cases into age groups. We then used data from Ferguson and colleagues at Imperial College (Table 1) (https://www.imperial.ac.uk/media/imperial-college/medicine/sph/ide/gida-fellowships/Imperial-College-COVID19-NPI-modelling-16-03-2020.pdf?fbclid=IwAR17JB7RqzU491sxa8eV1gqHFv-GTl2vh06sOUGaqaQ9RJ5vjWO_jNZbWjo) on age-related proportions of hospital admissions in our prediction of the number of patients in Iceland who might be admitted to hospital and/or intensive care.
-
- There are various reasons why such age-related risks should be different in Iceland than in Hubei.
- For example, this implicit assumption is that the distribution of risk factors for the serious consequences of the disease is similar. In addition, it is assumed that decisions about when it is time to admit people into hospital or intensive care will be the same.
- Discrepancies between predictions and the number of intensive care units could indicate that the epidemic response is different here than in Hubei.
- However, this assumption is necessary at the beginning of the epidemic while there is insufficient data on hospital and intensive care in this country.
- It should be kept in mind that the age distribution of infected individuals in Iceland is favorable so far. If the number of infections among the elderly increases, it will significantly impact the prediction model towards an increased burden on the health care system.
- All code can be found here: website In addition, techincal report on methods behind the development of the prediction model can be found here. Finally, a dashboard measuring the development of COVID-19 in Iceland and elsewhere can be found here.
Results
Diagnosed COVID-19 cases
Cumulative confirmed infections in total
Active diagnosed infections each day
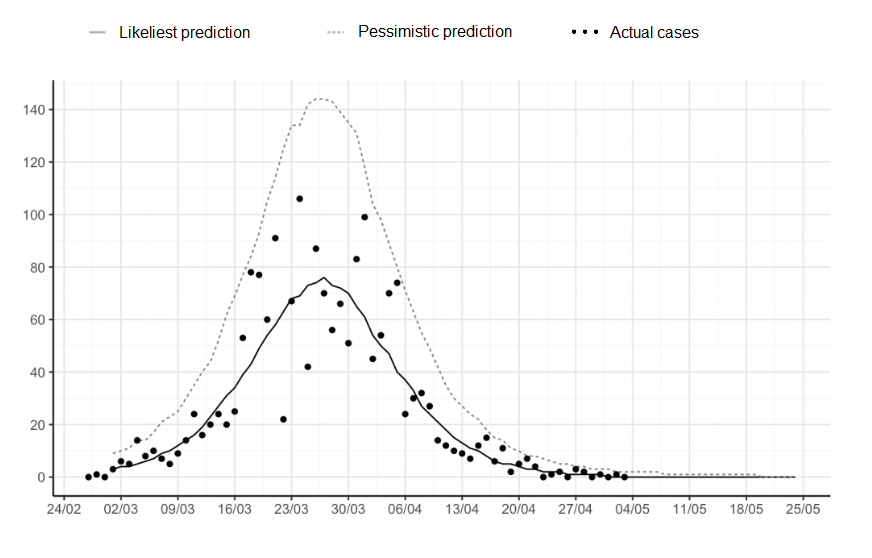
New diagnosed infections each day
Hospitalization
Cumulative hospitalizations
Cumulative total of hospitalizations
Active hospitalizations each day
Intensive care
Cumulative intensive care admissions
Cumulative total of individuals in intensive care
Number of individuals in intensive care each day
Distribution by age
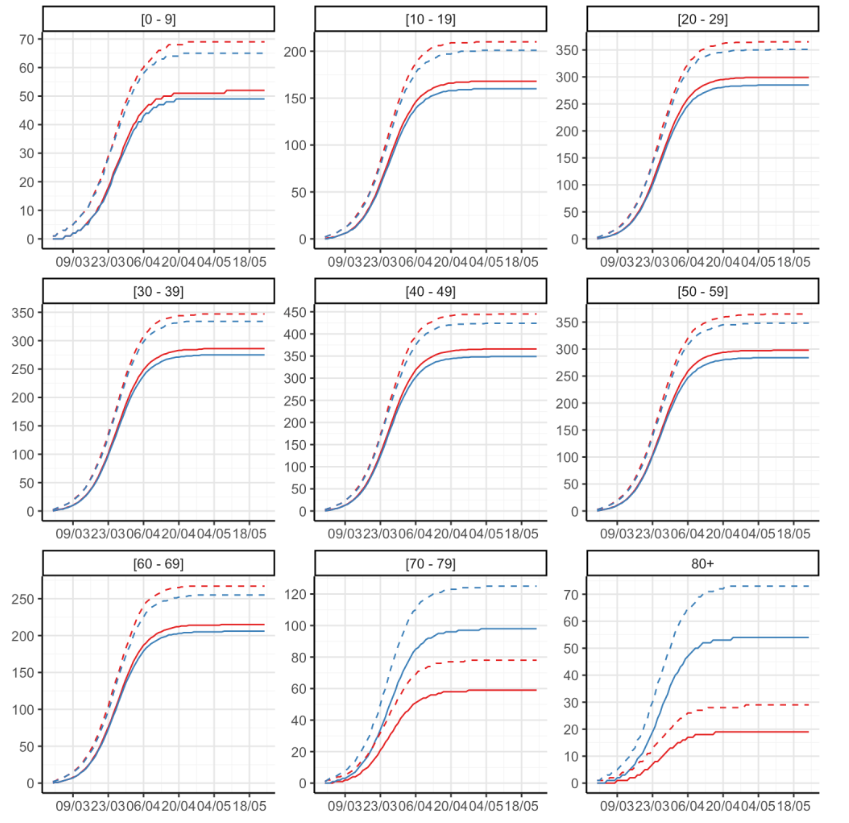
Diagnosed infections
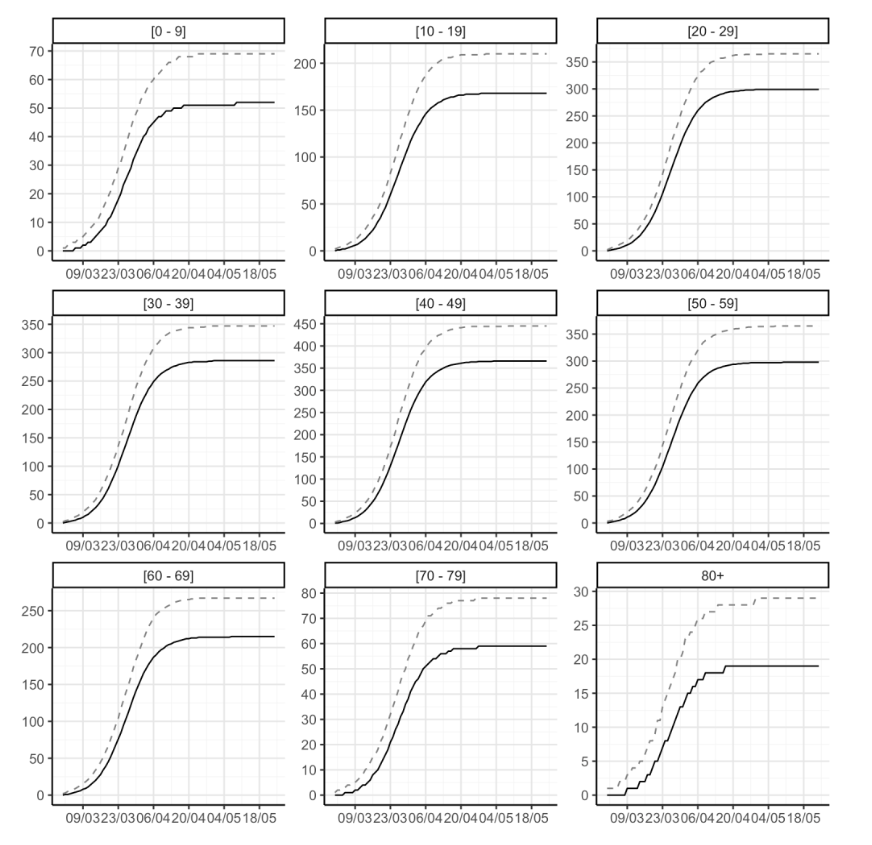
Cumulative
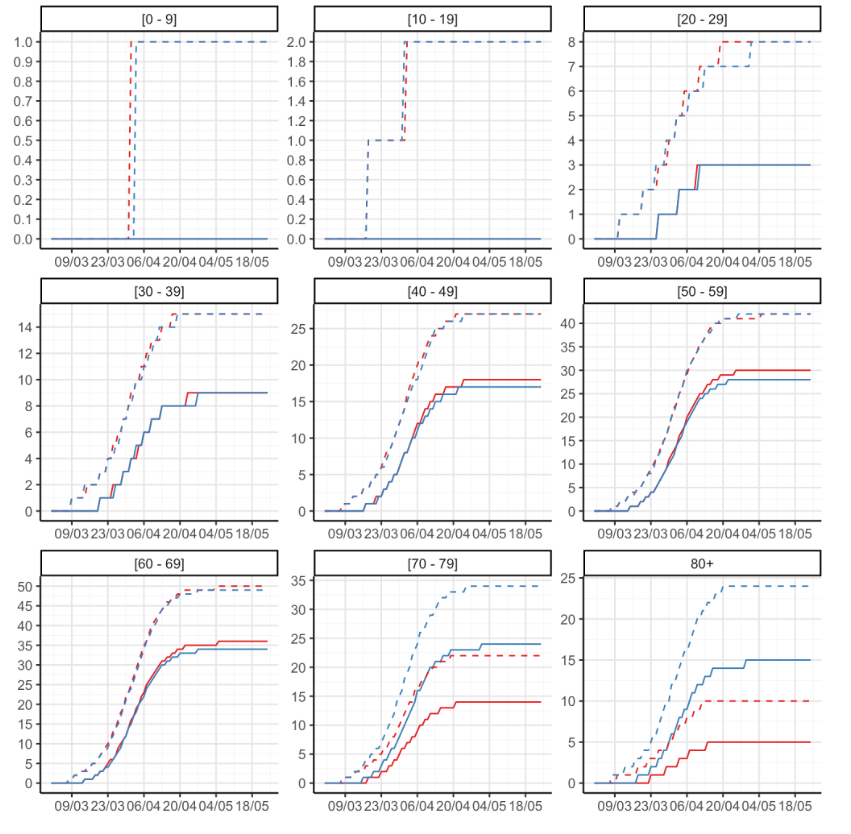
Cumulative diagnosed infections by age
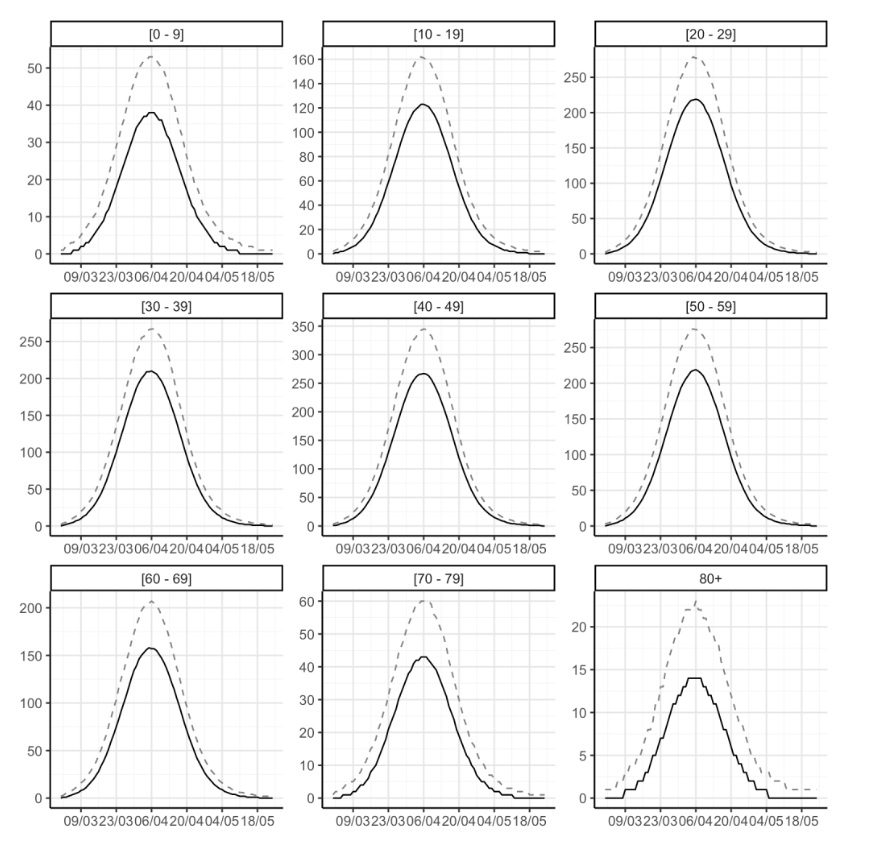
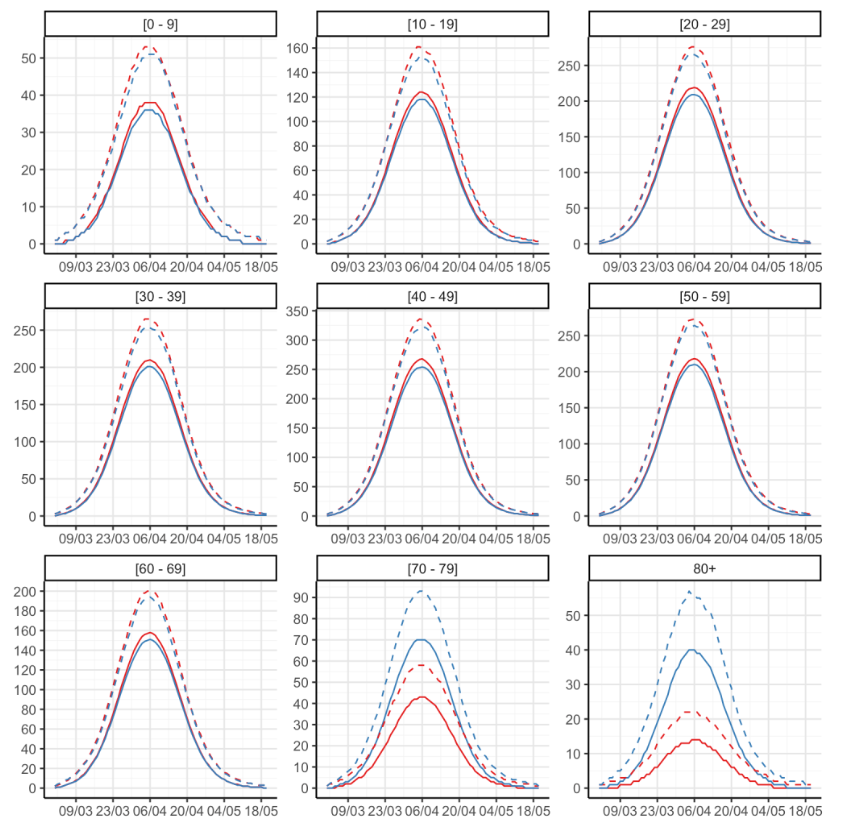
Active
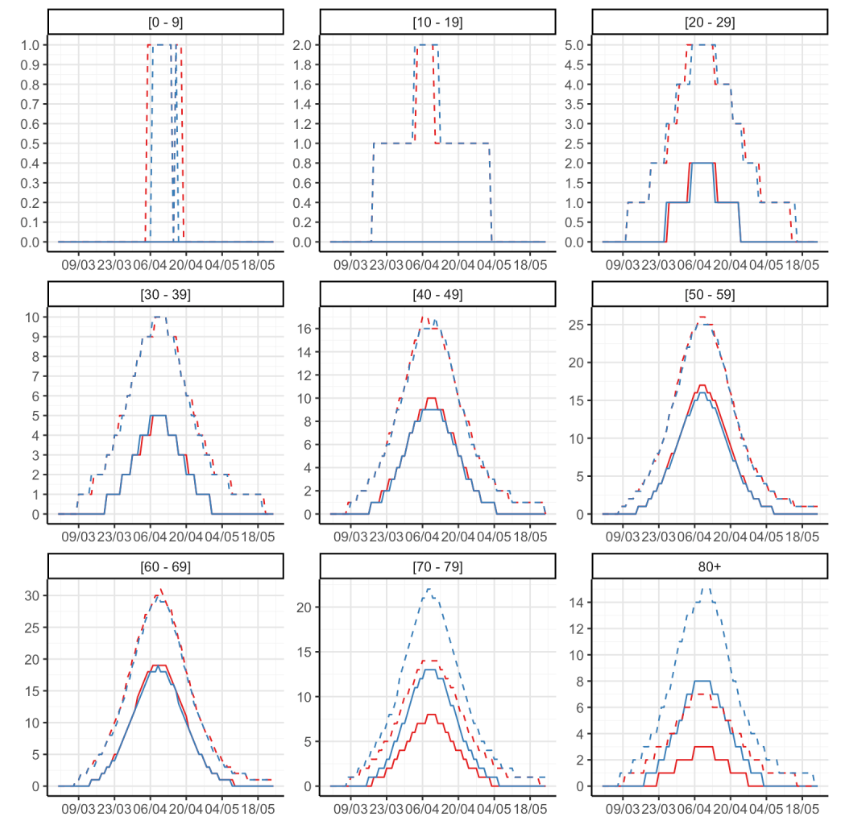
Active infections by age
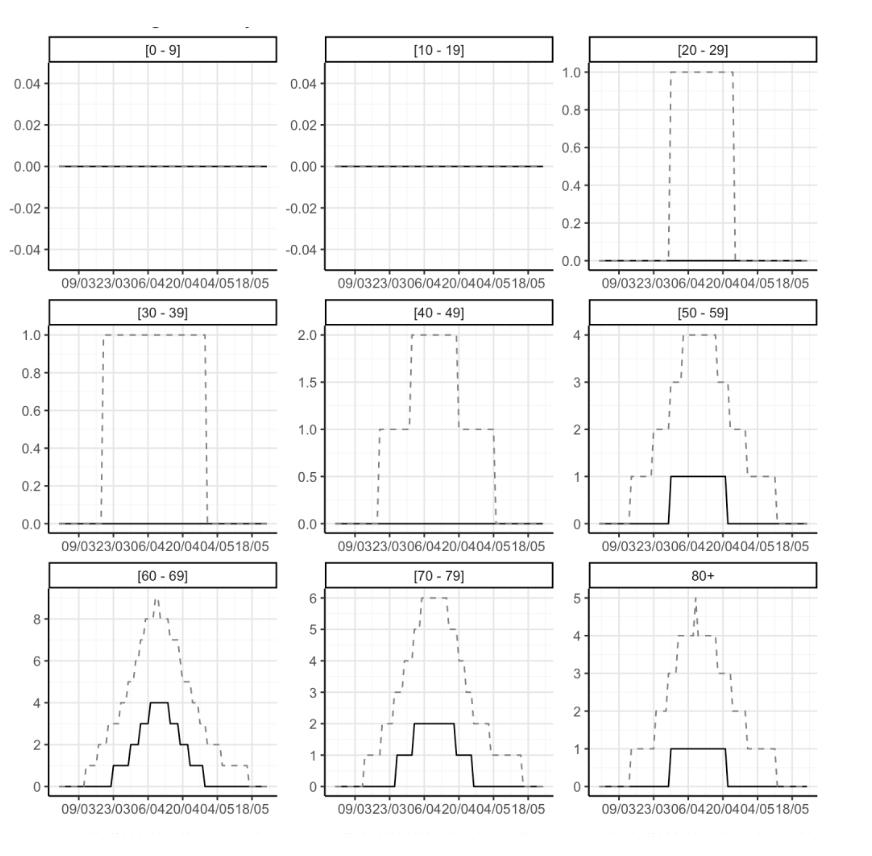
Hospitalizations
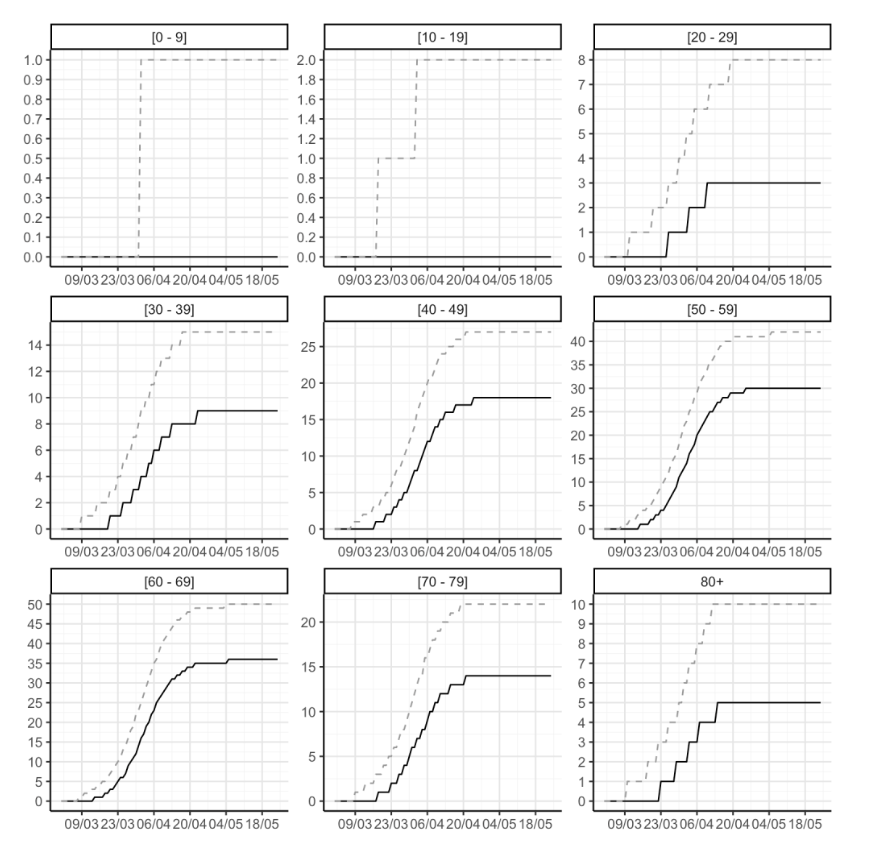
Cumulative
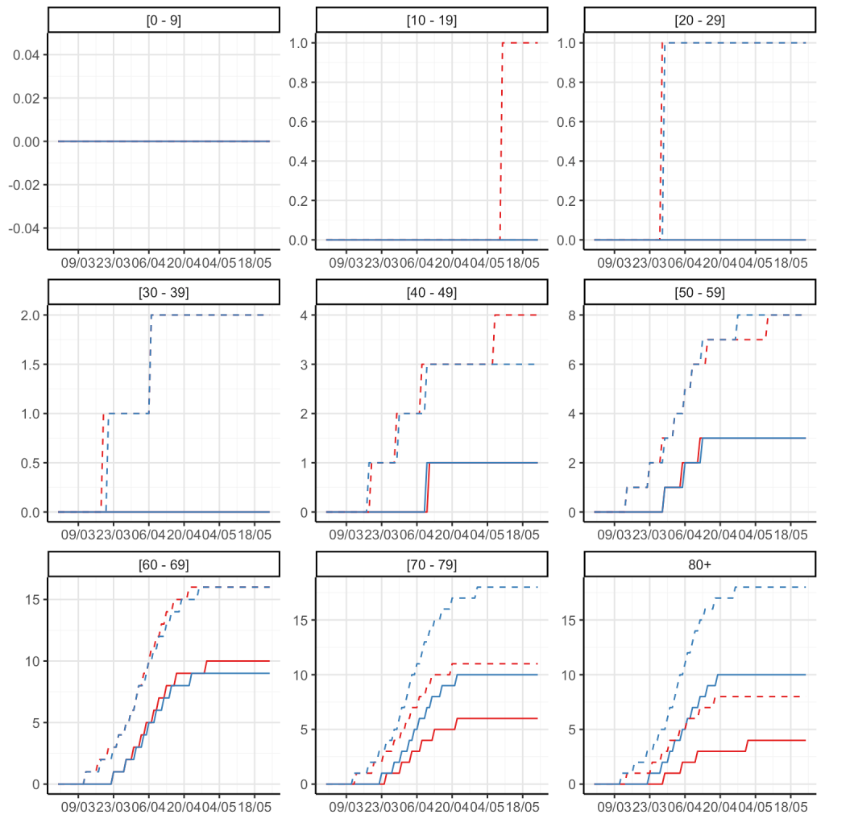
Cumulative total of hospital admissions by age
Active
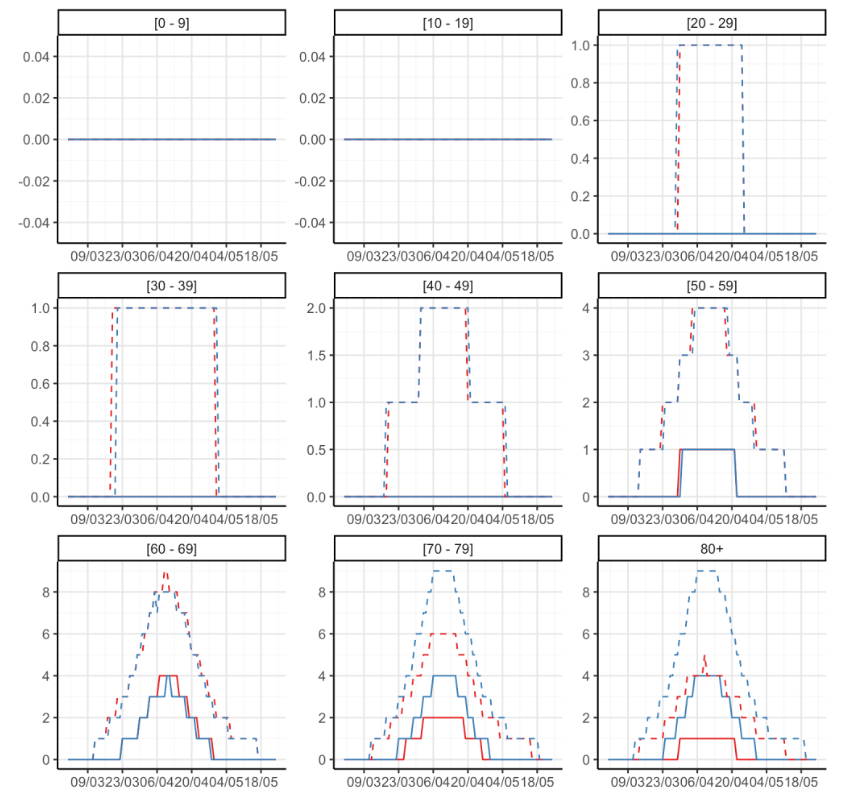
Active hospital admissions by age
Intensive care
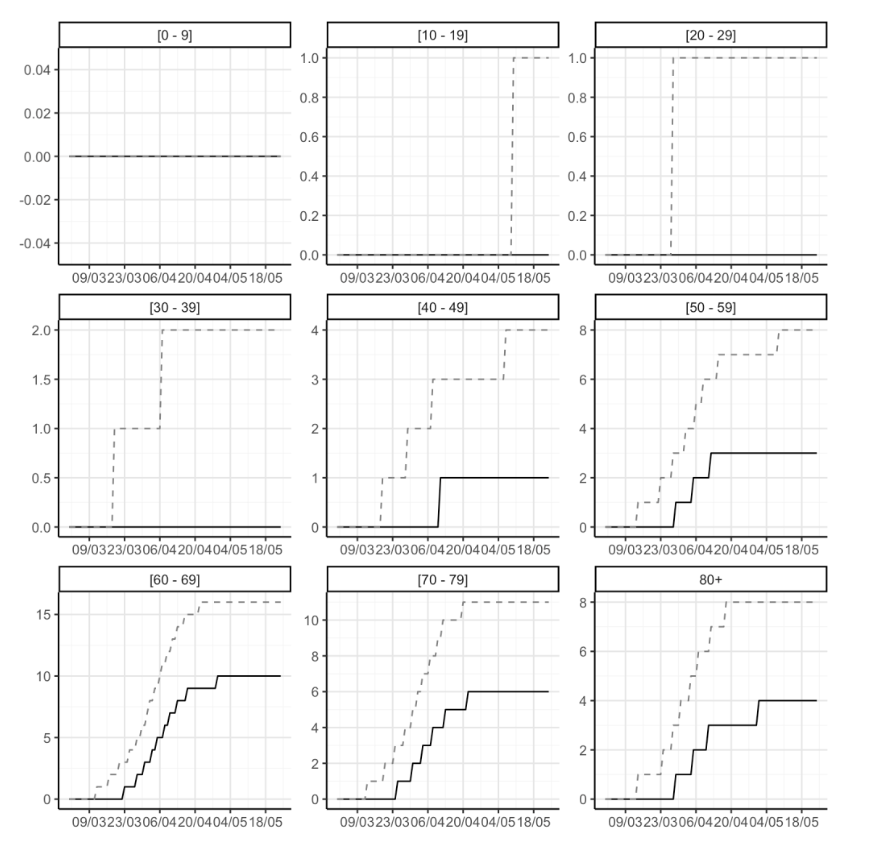
Cumulative
Cumulative total of individuals in intensive care units by age
Active
Total of individuals with active infections by age
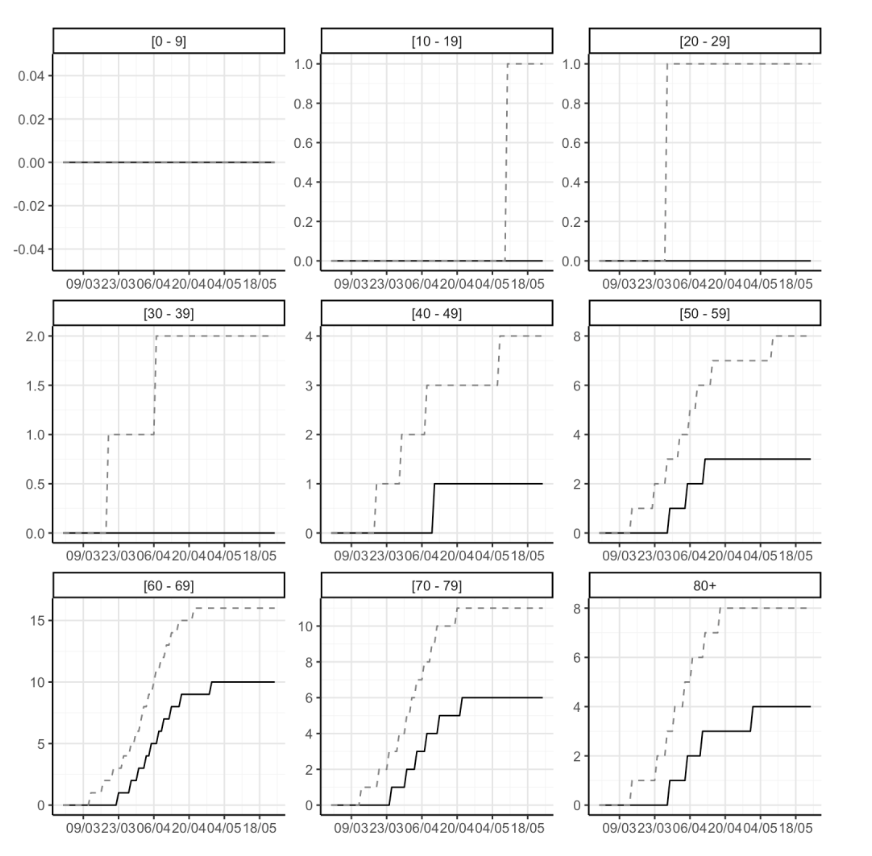
Results with a different age distribution
Different age distribution
The following is a simulation of development based on the fact that transmission is proportionally more prevalent in older age groups than it currently does:
Hospitalizations
Cumulative
Active
Intensive care
Cumulative
Active each day
Distribution by age
Diagnosed infections
Cumulative
Active
Hospitalizations
Cumulative
Active
Intensive care
Cumulative
Active
Annex
Information on data for prediction model:
|
Rate
|
||||
|---|---|---|---|---|
| Country | First inspection | Number of days | Beginning | Now |
| Albania | 2020-04-04 | 31 | 0.1055220 | 0.2759538 |
| Armenia | 2020-03-27 | 39 | 0.1112339 | 0.8066995 |
| Australia | 2020-03-26 | 40 | 0.1110573 | 0.2698467 |
| Austria | 2020-03-17 | 49 | 0.1134549 | 1.7416887 |
| Azerbaijan | 2020-04-12 | 23 | 0.1052975 | 0.1922825 |
| Bahamas | 2020-04-09 | 26 | 0.1027005 | 0.2131036 |
| Bahrain | 2020-03-14 | 52 | 0.1279573 | 2.0613318 |
| Barbados | 2020-03-30 | 36 | 0.1149726 | 0.2856894 |
| Belarus | 2020-04-09 | 26 | 0.1127755 | 1.7672740 |
| Belgium | 2020-03-18 | 48 | 0.1077186 | 4.3248619 |
| Bosnia And Herzegovina | 2020-03-31 | 35 | 0.1069373 | 0.5625568 |
| Brazil | 2020-04-13 | 22 | 0.1050417 | 0.4792572 |
| Bulgaria | 2020-04-15 | 20 | 0.1018554 | 0.2311389 |
| Canada | 2020-03-27 | 39 | 0.1074014 | 1.5897443 |
| Cape Verde | 2020-04-16 | 19 | 0.1000118 | 0.3000355 |
| Chile | 2020-03-29 | 37 | 0.1007280 | 1.0375137 |
| Colombia | 2020-04-26 | 9 | 0.1021465 | 0.1523259 |
| Costa Rica | 2020-04-10 | 25 | 0.1067842 | 0.1464073 |
| Croatia | 2020-03-26 | 40 | 0.1012032 | 0.5074687 |
| Cuba | 2020-04-22 | 13 | 0.1003222 | 0.1454981 |
| Cyprus | 2020-03-25 | 41 | 0.1051247 | 0.7392643 |
| Denmark | 2020-03-13 | 53 | 0.1171196 | 1.6498968 |
| Djibouti | 2020-04-08 | 27 | 0.1242861 | 1.1421998 |
| Dominican Republic | 2020-04-01 | 34 | 0.1032689 | 0.7406678 |
| Ecuador | 2020-03-29 | 37 | 0.1056196 | 1.7001597 |
| Equatorial Guinea | 2020-04-25 | 10 | 0.1563438 | 0.2323033 |
| Estonia | 2020-03-16 | 50 | 0.1289935 | 1.2823917 |
| Finland | 2020-03-23 | 43 | 0.1131566 | 0.9497201 |
| France | 2020-03-17 | 49 | 0.1018429 | 2.0157769 |
| French Polynesia | 2020-03-27 | 39 | 0.1074164 | 0.2076717 |
| Georgia | 2020-04-21 | 14 | 0.1005813 | 0.1473692 |
| Germany | 2020-03-20 | 46 | 0.1692828 | 1.9537928 |
| Greece | 2020-03-29 | 37 | 0.1013037 | 0.2507291 |
| Hungary | 2020-04-09 | 26 | 0.1011908 | 0.3133816 |
| Iceland | 2020-03-05 | 60 | 0.1091346 | 5.3062994 |
| Iran | 2020-03-12 | 54 | 0.1085463 | 1.1750019 |
| Ireland | 2020-03-20 | 46 | 0.1140810 | 4.4047152 |
| Israel | 2020-03-22 | 44 | 0.1036461 | 1.9024865 |
| Italy | 2020-03-09 | 57 | 0.1218000 | 3.4800452 |
| Jamaica | 2020-04-26 | 9 | 0.1034502 | 0.1590759 |
| Japan | 2020-04-25 | 10 | 0.1016236 | 0.1186896 |
| Kazakhstan | 2020-04-21 | 14 | 0.1050593 | 0.2136763 |
| Kuwait | 2020-04-05 | 30 | 0.1138556 | 1.1844311 |
| Kyrgyzstan | 2020-04-24 | 11 | 0.1022468 | 0.1293671 |
| Latvia | 2020-03-25 | 41 | 0.1033175 | 0.4609955 |
| Lebanon | 2020-04-24 | 11 | 0.1003543 | 0.1075016 |
| Lithuania | 2020-03-27 | 38 | 0.1083480 | 0.5250710 |
| Luxembourg | 2020-03-16 | 50 | 0.1250550 | 6.2105244 |
| Malaysia | 2020-04-04 | 31 | 0.1043200 | 0.1971219 |
| Maldives | 2020-04-21 | 14 | 0.1299550 | 0.9925549 |
| Malta | 2020-03-19 | 47 | 0.1089988 | 1.0831751 |
| Mauritius | 2020-03-31 | 35 | 0.1067935 | 0.2786642 |
| Mexico | 2020-04-25 | 10 | 0.1008971 | 0.1839773 |
| Moldova | 2020-04-02 | 33 | 0.1046185 | 1.0192263 |
| Montenegro | 2020-03-27 | 39 | 0.1066901 | 0.5127495 |
| Morocco | 2020-04-25 | 10 | 0.1030386 | 0.1344327 |
| Netherlands | 2020-03-19 | 47 | 0.1199617 | 2.3729714 |
| New Zealand | 2020-03-30 | 36 | 0.1154072 | 0.2377138 |
| North Macedonia | 2020-03-28 | 38 | 0.1051137 | 0.7252363 |
| Norway | 2020-03-13 | 53 | 0.1154520 | 1.4517954 |
| Oman | 2020-04-12 | 23 | 0.1097491 | 0.5161824 |
| Panama | 2020-03-25 | 41 | 0.1043227 | 1.6948318 |
| Peru | 2020-04-09 | 26 | 0.1335570 | 1.4127149 |
| Poland | 2020-04-06 | 29 | 0.1082671 | 0.3614095 |
| Portugal | 2020-03-22 | 43 | 0.1251688 | 2.4790276 |
| Puerto Rico | 2020-04-03 | 32 | 0.1077245 | 0.6163479 |
| Qatar | 2020-03-14 | 52 | 0.1129917 | 5.4910424 |
| Romania | 2020-03-31 | 35 | 0.1008027 | 0.6797470 |
| Russia | 2020-04-13 | 22 | 0.1081083 | 0.9233216 |
| Saudi Arabia | 2020-04-11 | 24 | 0.1065409 | 0.7882159 |
| Serbia | 2020-04-01 | 34 | 0.1025964 | 1.0788585 |
| Singapore | 2020-03-27 | 39 | 0.1023373 | 3.1364478 |
| Slovakia | 2020-04-08 | 27 | 0.1064685 | 0.2580166 |
| Slovenia | 2020-03-16 | 50 | 0.1053566 | 0.6922749 |
| Spain | 2020-03-15 | 49 | 0.1230936 | 4.6529953 |
| Sweden | 2020-03-16 | 50 | 0.1028259 | 2.2236107 |
| Switzerland | 2020-03-14 | 52 | 0.1304798 | 3.4711597 |
| Turkey | 2020-03-30 | 36 | 0.1104764 | 1.5107945 |
| Ukraine | 2020-04-17 | 18 | 0.1014238 | 0.2707892 |
| United Arab Emirates | 2020-04-03 | 32 | 0.1048050 | 1.4495633 |
| United Kingdom | 2020-03-25 | 41 | 0.1196058 | 2.7631945 |
| United States | 2020-03-23 | 43 | 0.1069880 | 3.5191871 |
| Uruguay | 2020-04-03 | 32 | 0.1037053 | 0.1892115 |
The head of the prediction model on behalf of University of Iceland’s Health Sciences Institute is Dr. Thor Aspelund. The prediction model is conducted by scientists from the University of Iceland, the Directorate of Health, and the National Hospital. Contact us: covid@hi.is