COVID-19 in Iceland
A prediction model for the number of individuals diagnosed with COVID-19 and the corresponding burden on the health care system.
2020-03-30
Summary
The method of estimating the prediction model has been improved from March 25th, but now we assume that the daily number of detected infections is accompanied by a probability distribution that allows a more realistic estimate of uncertainty (variance) from day to day. As a result, the pessimistic forecast has risen.
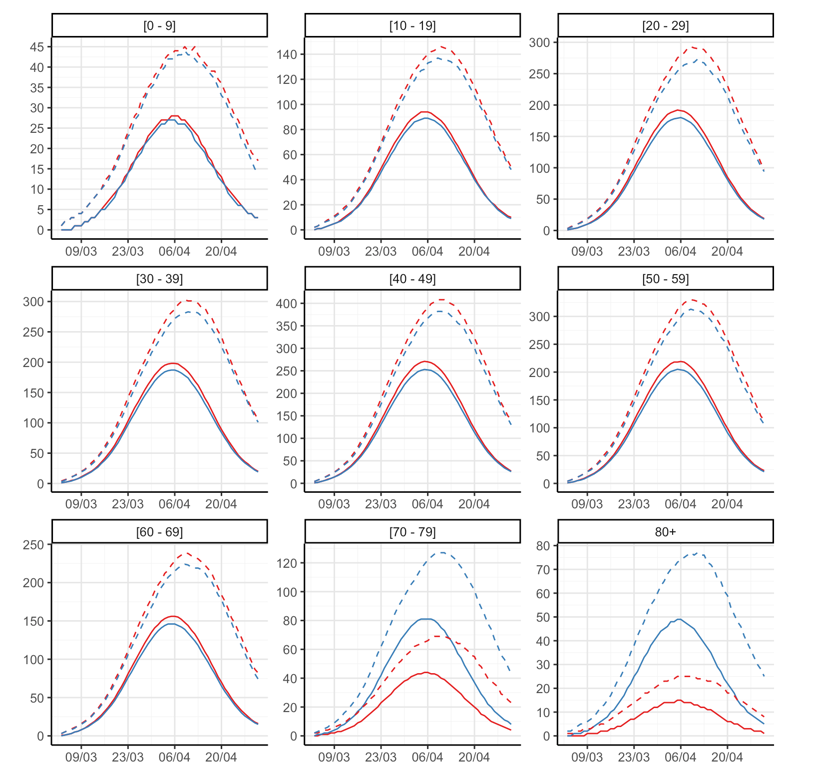
The prediction of the total number of infections has changed little since March 25th, but forecasts of the burden on the health system have risen, as the age distribution of diagnosed infections in Iceland has changed. In order to prepare for the possibility of further change, there is now another forecast which assumes that the age distribution will be more unfavorable.
The main results of the prediction model, with data through March 29th, are as follows:
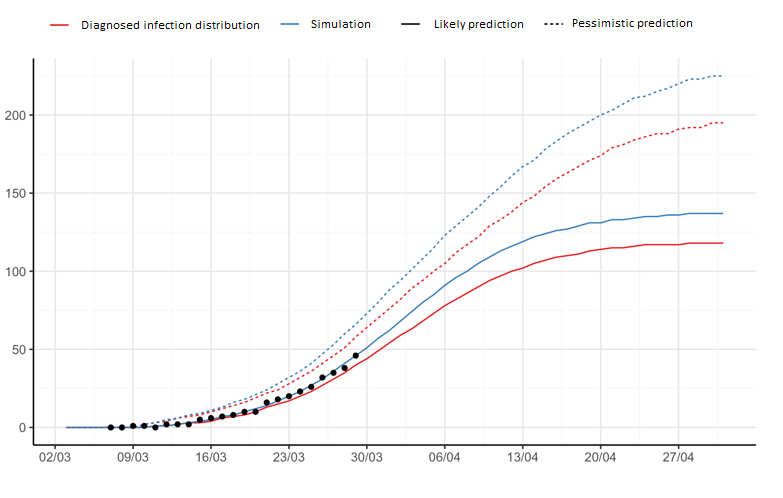
- It is expected that throughout the epidemic, about 1700 individuals in Iceland will have been diagnosed with COVID-19, but the number could reach as high as 2800 individuals, according to the pessimistic forecast.
- It is expected that the number of diagnosed individuals with an active disease will peak in the first week of April and will at that time probably be about 1200, but could be as many as 1800 individuals according to the pessimistic forecast.
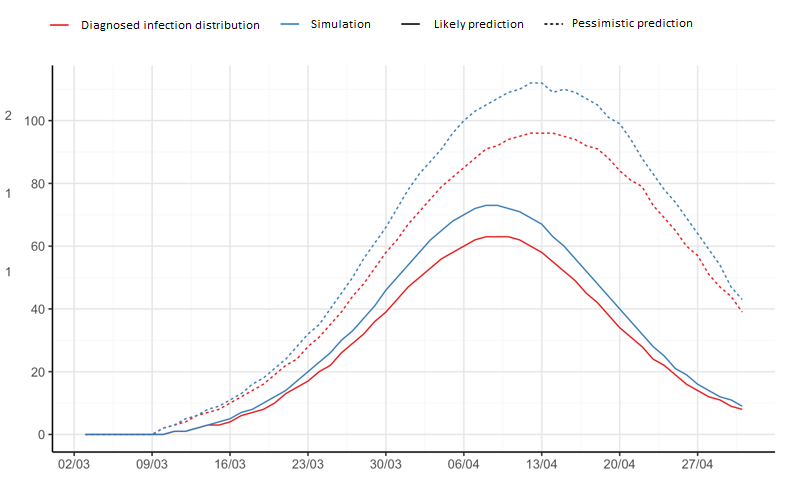
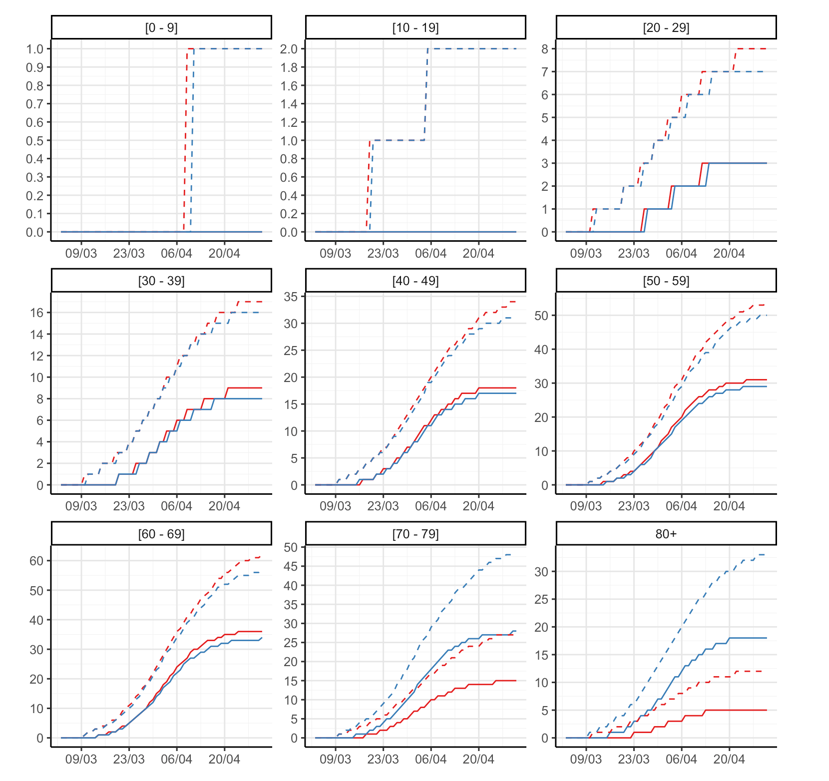
- It is expected that while the epidemic is ongoing, about 120 individuals will need hospitalization but this number might reach 200 according to the pessimistic forecast.
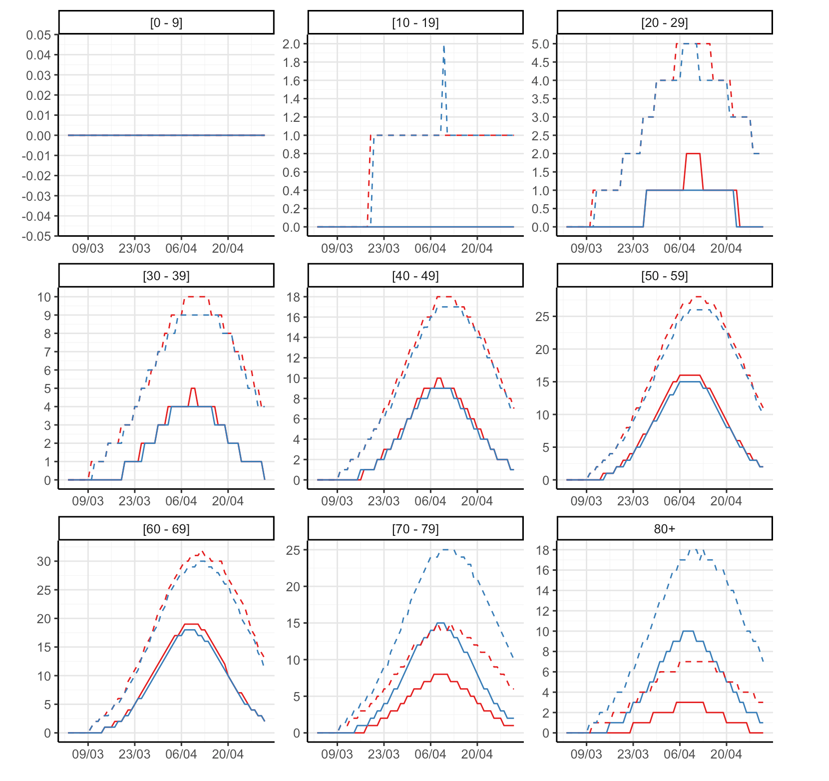
- The greatest burden on health care services due to hospital admissions will be around mid-April. At that time it is expected that around 60 individuals will be hospitalized but the pessimistic forecast predicts 100 individuals.
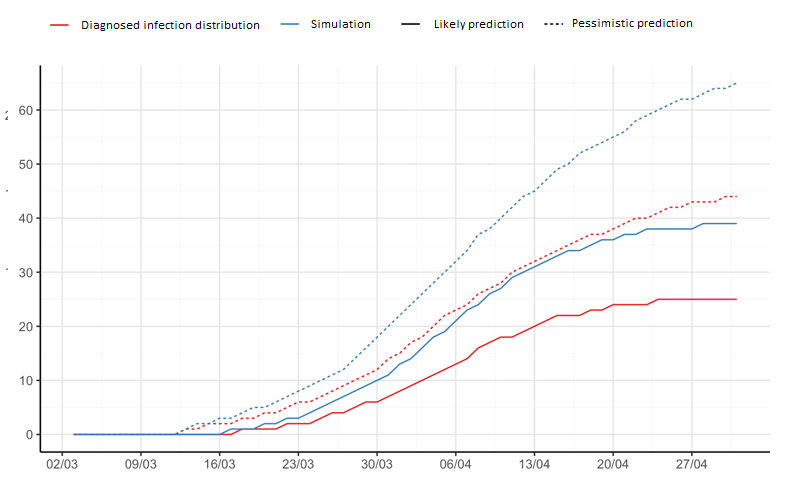
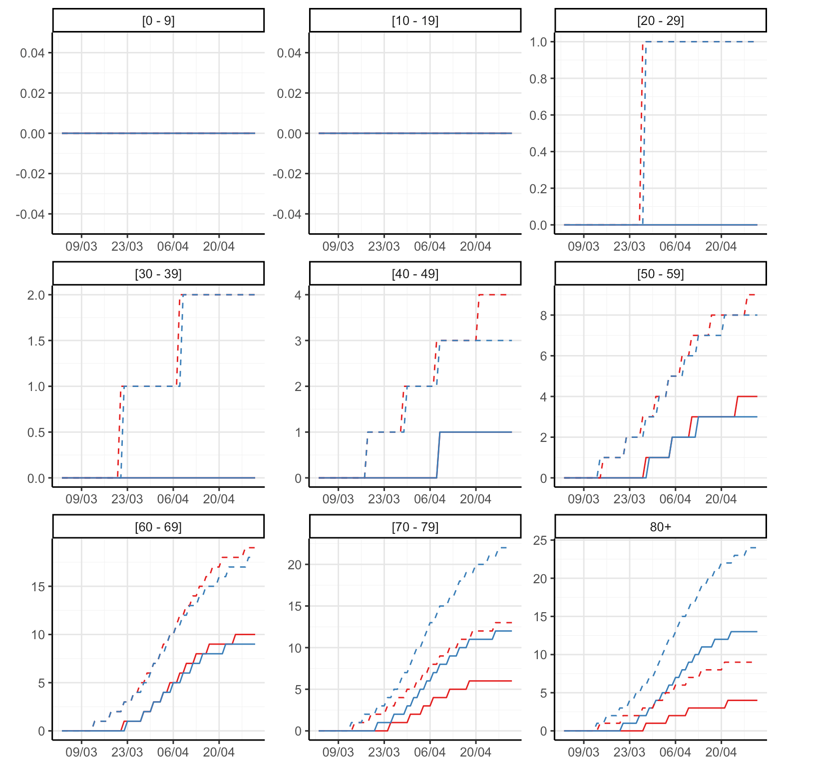
- It is expected that during the epidemic, approximately 25 individuals will become seriously ill (i.e. hospitalized in intensive care units), but this number might turn out to be as high as 44, according to the pessimistic forecast.
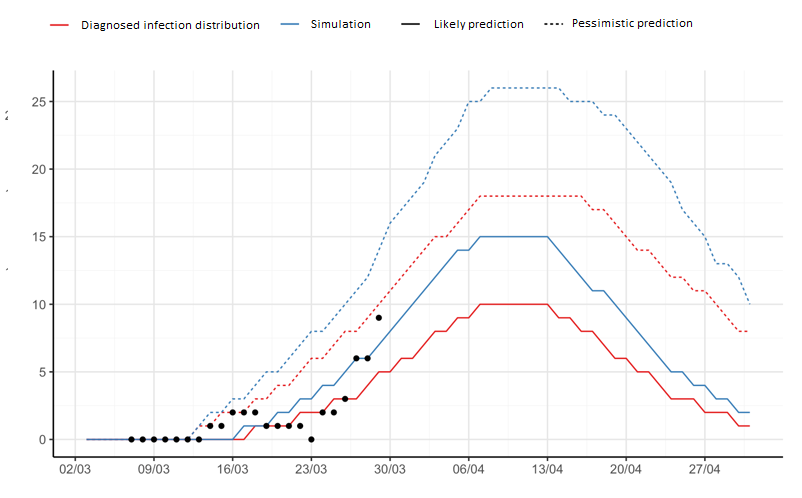
- The heaviest burden on intensive care units is likely to be in the second week of April, when 10 COVID-19 patients are anticipated to need intensive care at the same time, or even 18 according to the pessimistic forecast.
The analytical work continues and the prediction model will be updated regularly with new data. It is necessary to keep in mind that as Iceland‘s population is small (about 360.000) the number of confirmed cases can vary greatly from day to day, which will affect the results of the prediction model. The model will, though, become more stable as time passes.
Methods and premises of the prediction model
- We used a logistic growth model with Poisson distribution of the number of already diagnosed COVID-19 infections in Iceland to predict the median (likeliest prediction) and 97.5% upper limit (pessimistic prediction) of the cumulative number of confirmed COVID-19 cases in Iceland and active diagnosed cases (assuming 21 days of illness) in the upcoming weeks.
- The epidemic prediction model assumes exponential growth of diagnosed infections to slow down at some point stop, as the epidemic reaches its peak and the number of active infections subsequently starts to decline.
- The calculation method used to assess the shape of the growth curve in Iceland takes into account information on COVID-19 epidemic processes in other countries (see annex) to estimate the possible shape of the process in Iceland. Countries that have progressed further in the epidemic, e.g. South Korea, weigh more than the ones not as far into it.
- Since all infected individuals in Iceland are clients of the Icelandic health care system, the forecast is based on the total number of infected individuals in Iceland, regardless of the source of infection, whether individuals are diagnosed in quarantine or not, whether they are diagnosed through the screening through the healthcare services or deCODE genetics. It should be kept in mind that infected individuals in quarantine may possibly add less to the exponential growth than other individuals.
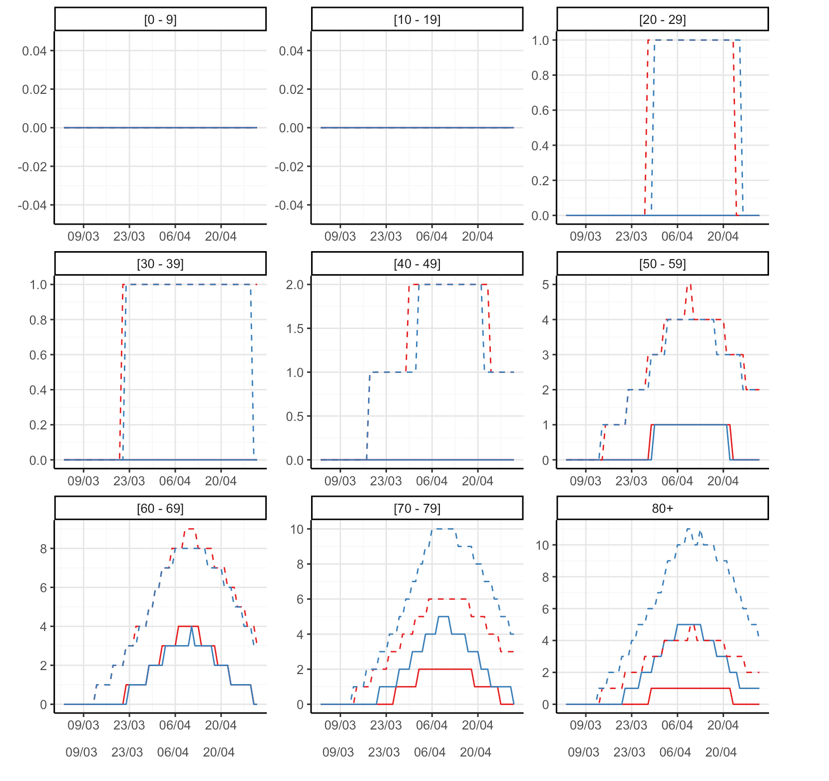
- We used the age distribution of already confirmed COVID-19 cases in Iceland to estimate the distribution of future cases into age groups. We then used data from Ferguson and colleagues at Imperial College (Table 1) (https://www.imperial.ac.uk/media/imperial-college/medicine/sph/ide/gida-fellowships/Imperial-College-COVID19-NPI-modelling-16-03-2020.pdf?fbclid=IwAR17JB7RqzU491sxa8eV1gqHFv-GTl2vh06sOUGaqaQ9RJ5vjWO_jNZbWjo) on age-related proportions of hospital admissions in our prediction of the number of patients in Iceland who might be admitted to hospital and/or intensive care.
- It should be kept in mind that the age dstribution of infected individuals in Iceland is favorable so far. If the number of infections among the elderly increases, it will significantly impact the prediction model towards an increased burden on the health care system.
- All code can be found here: website In addition, techincal report on methods behind the development of the prediction model can be found here. Finally, a dashboard measuring the development of COVID-19 in Iceland and elsewhere can be found here.
Results
Diagnosed COVID-19 cases
Cumulative diagnosed infections
Cumulative confirmed infections in total

Active diagnosed infections each day

Hospitalization
Cumulative hospitalizations
Cumulative total of hospitalizations

Hospitalizations each day
Number of individuals in hospitals in total

Intensive care
Cumulative intensive care admissions
Cumulative total of individuals in intensive care
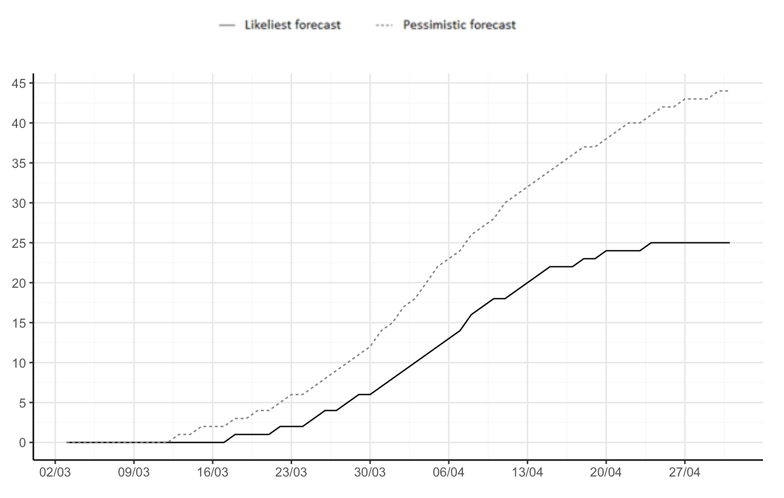
Number of individuals in intensive care each day
Total number of individuals in intensive care

Distribution by age
Diagnosed infections
Cumulative
Cumulative diagnosed infections by age

Active
Active infections by age
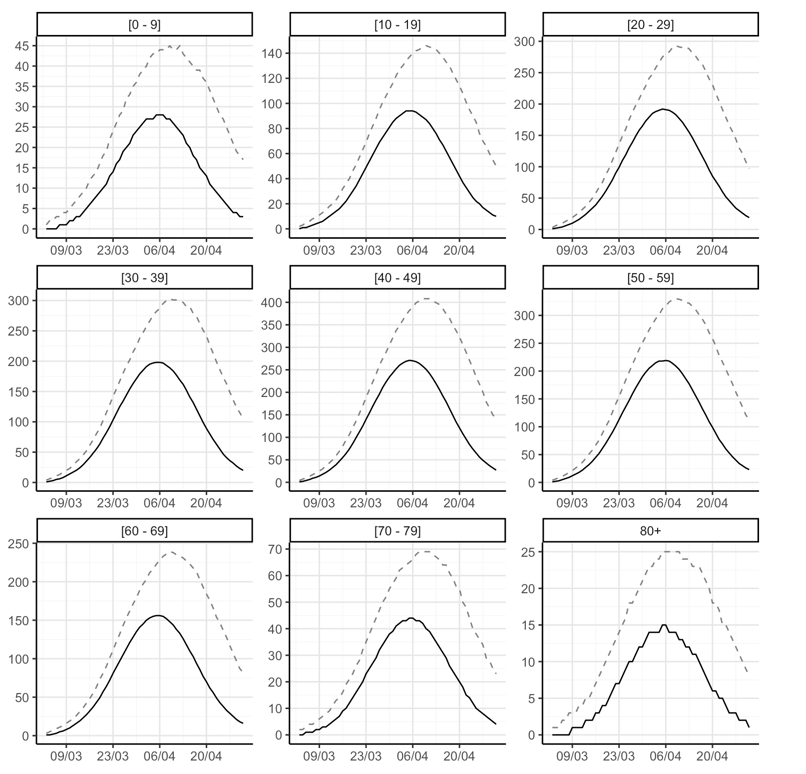
Hospitalizations
Cumulative
Cumulative total of hospital admissions by age
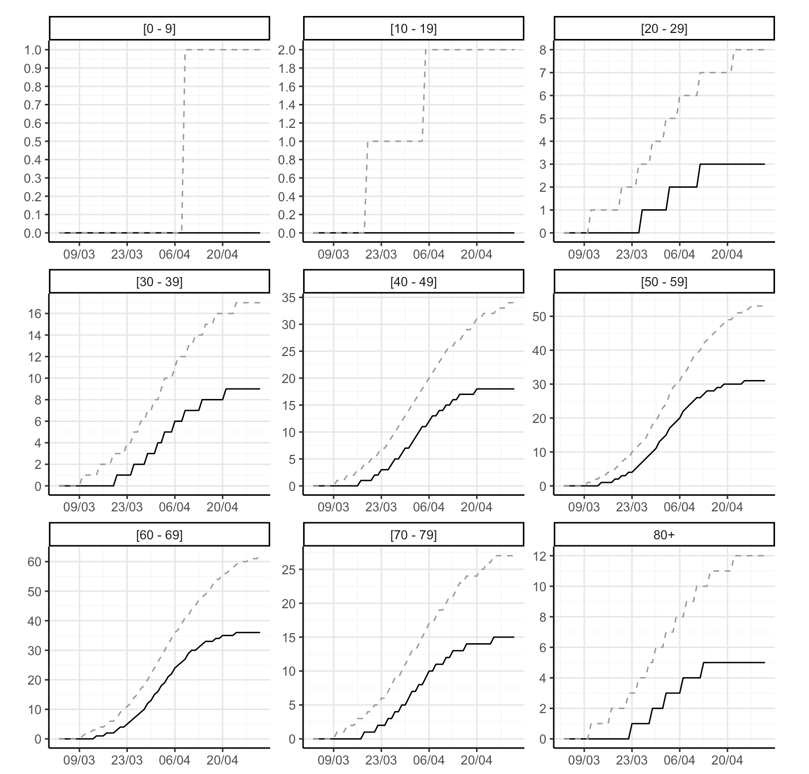
Active
Active hospital admissions by age
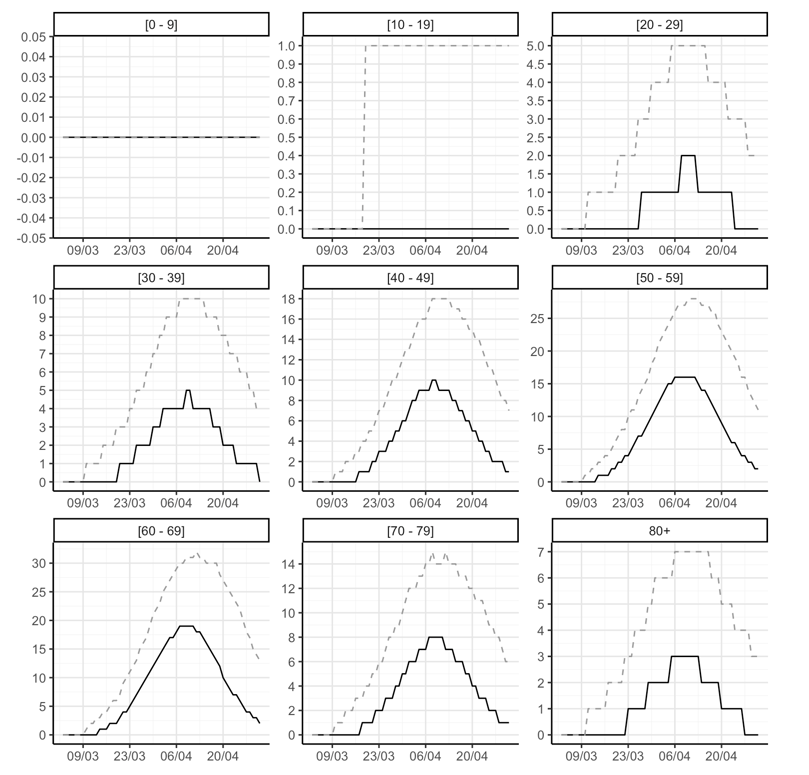
Intensive care
Cumulative
Cumulative total of individuals in intensive care units by age
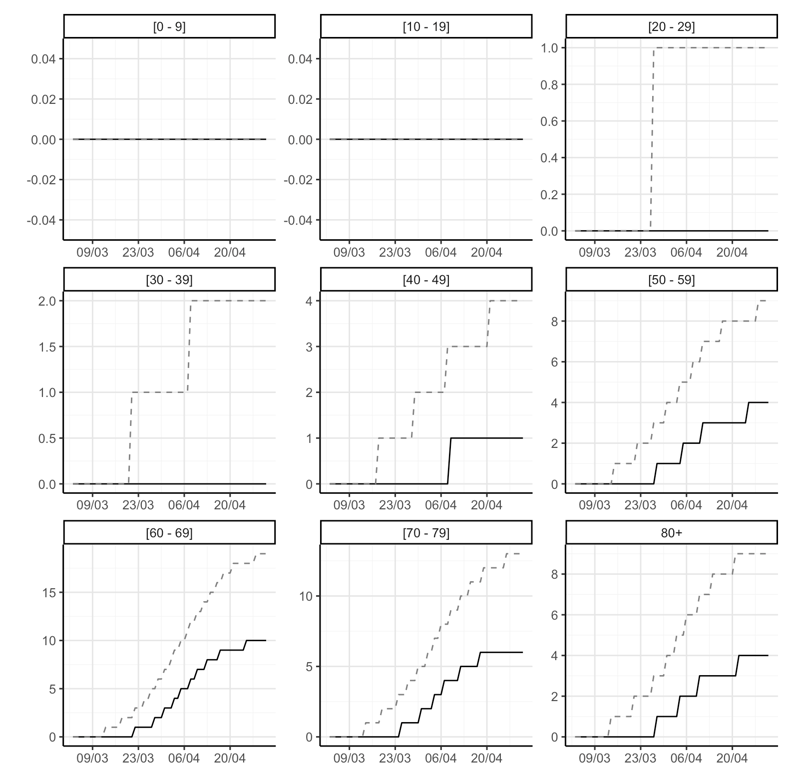
Active
Total of individuals with active infections by age
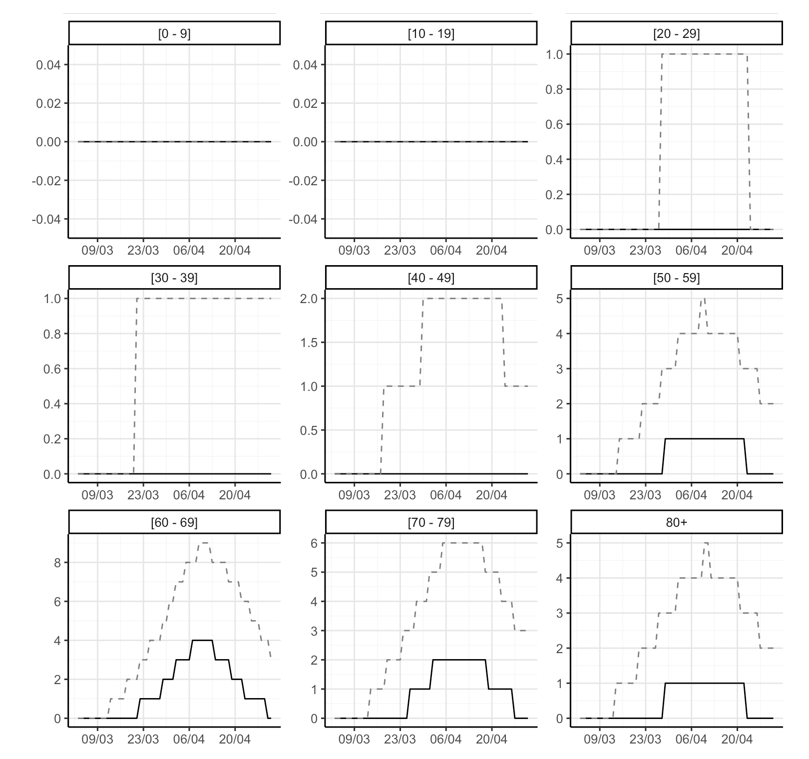
Results with a different age distribution
Different age distribution
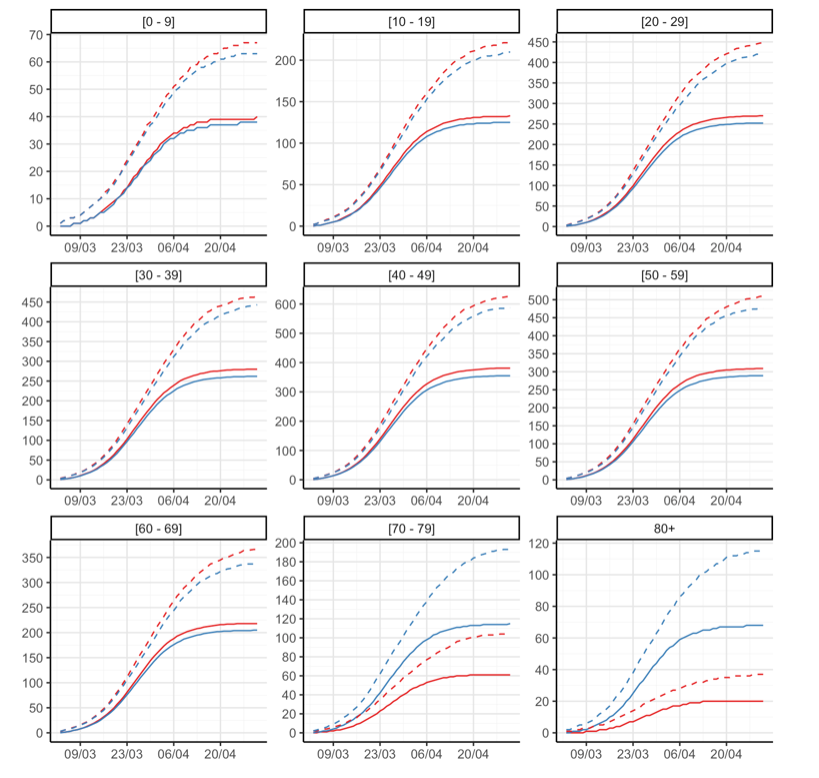
The following is a simulation of development based on the fact that transmission is proportionally more prevalent in older age groups than it currently does:
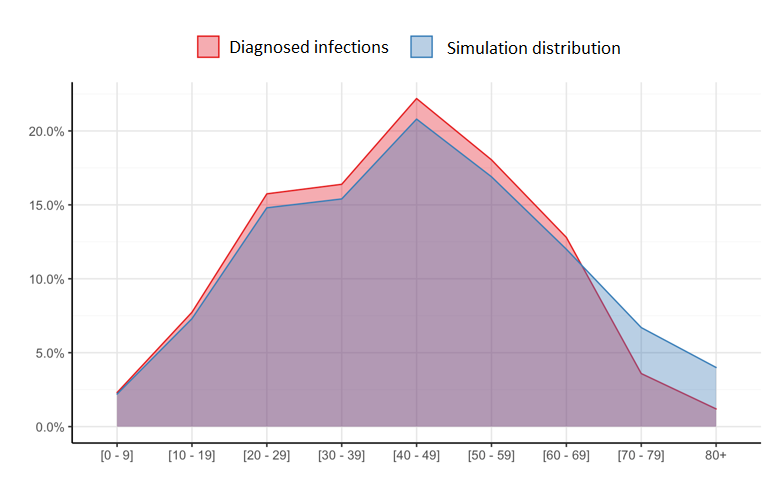
Hospitalizations
Cumulative
Active
Intensive care
Cumulative
Active each day
Distribution by age
Diagnosed infections
Cumulative
Active
Hospitalizations
Cumulative
Active
Intensive care
Cumulative
Active
Annex
Information on data for prediction model:
|
Rate
|
||||
|---|---|---|---|---|
| Country | First observation | Total of days | Beginning | Now |
| Albania | 2020-03-19 | 11 | 0.0204796 | 0.0683810 |
| Andorra | 2020-03-14 | 15 | 0.0259262 | 3.9926370 |
| Armenia | 2020-03-18 | 12 | 0.0263716 | 0.1433531 |
| Australia | 2020-03-19 | 11 | 0.0224178 | 0.1511316 |
| Austria | 2020-03-11 | 19 | 0.0203236 | 0.9258409 |
| Bahrain | 2020-02-27 | 31 | 0.0201076 | 0.2882087 |
| Barbados | 2020-03-21 | 9 | 0.0209041 | 0.0905844 |
| Belgium | 2020-03-10 | 20 | 0.0207118 | 0.7915539 |
| Bermuda | 2020-03-20 | 10 | 0.0319969 | 0.3519662 |
| Bosnia And Herzegovina | 2020-03-22 | 8 | 0.0278703 | 0.0778552 |
| Bulgaria | 2020-03-22 | 8 | 0.0232853 | 0.0472849 |
| Canada | 2020-03-20 | 10 | 0.0226136 | 0.1439682 |
| Cayman Islands | 2020-03-21 | 9 | 0.0461908 | 0.1231755 |
| Chile | 2020-03-21 | 9 | 0.0228999 | 0.1007280 |
| Costa Rica | 2020-03-21 | 9 | 0.0223870 | 0.0584441 |
| Croatia | 2020-03-20 | 10 | 0.0251797 | 0.1590682 |
| Cyprus | 2020-03-16 | 14 | 0.0254334 | 0.1517527 |
| Czech Republic | 2020-03-15 | 15 | 0.0200202 | 0.2491298 |
| Denmark | 2020-03-11 | 19 | 0.0457390 | 0.3813318 |
| Ecuador | 2020-03-21 | 9 | 0.0245199 | 0.1056196 |
| Estonia | 2020-03-13 | 17 | 0.0203674 | 0.4827828 |
| Finland | 2020-03-13 | 16 | 0.0280180 | 0.2201673 |
| France | 2020-03-10 | 20 | 0.0216798 | 0.5769255 |
| French Polynesia | 2020-03-21 | 9 | 0.0537082 | 0.1217386 |
| Germany | 2020-03-13 | 17 | 0.0283655 | 0.6291770 |
| Greece | 2020-03-15 | 15 | 0.0217693 | 0.1013037 |
| Greenland | 2020-03-20 | 10 | 0.0352908 | 0.1764540 |
| Iceland | 2020-03-02 | 28 | 0.0294958 | 3.2032469 |
| Iran | 2020-03-04 | 26 | 0.0281738 | 0.4270454 |
| Ireland | 2020-03-15 | 15 | 0.0264209 | 0.4946242 |
| Isle Of Man | 2020-03-22 | 8 | 0.0236451 | 0.3783221 |
| Israel | 2020-03-15 | 15 | 0.0208935 | 0.4247963 |
| Italy | 2020-03-02 | 28 | 0.0278943 | 1.5271988 |
| Kuwait | 2020-03-14 | 16 | 0.0237694 | 0.0558582 |
| Latvia | 2020-03-18 | 12 | 0.0319917 | 0.1599586 |
| Lebanon | 2020-03-20 | 10 | 0.0217337 | 0.0600959 |
| Liechtenstein | 2020-03-05 | 19 | 0.0263026 | 1.6044609 |
| Lithuania | 2020-03-21 | 9 | 0.0250034 | 0.1427729 |
| Luxembourg | 2020-03-13 | 16 | 0.0422264 | 2.9737108 |
| Malaysia | 2020-03-18 | 12 | 0.0210643 | 0.0726140 |
| Maldives | 2020-03-16 | 14 | 0.0244843 | 0.0301345 |
| Monaco | 2020-02-29 | 18 | 0.0256647 | 1.1035828 |
| Montenegro | 2020-03-20 | 10 | 0.0207011 | 0.1337607 |
| Netherlands | 2020-03-11 | 19 | 0.0223429 | 0.5709730 |
| North Macedonia | 2020-03-19 | 11 | 0.0201588 | 0.1156730 |
| Norway | 2020-03-07 | 23 | 0.0210082 | 0.7148359 |
| Panama | 2020-03-18 | 12 | 0.0202523 | 0.2121778 |
| Portugal | 2020-03-16 | 14 | 0.0239581 | 0.5055648 |
| San Marino | 2020-02-28 | 30 | 0.0295334 | 6.6154755 |
| Seychelles | 2020-03-15 | 15 | 0.0204627 | 0.0716193 |
| Singapore | 2020-03-06 | 24 | 0.0201573 | 0.1383448 |
| Slovakia | 2020-03-20 | 10 | 0.0225398 | 0.0540589 |
| Slovenia | 2020-03-12 | 18 | 0.0274216 | 0.3324267 |
| South Korea | 2020-02-26 | 33 | 0.0223718 | 0.1870755 |
| Spain | 2020-03-10 | 20 | 0.0257613 | 1.5458490 |
| Sweden | 2020-03-09 | 21 | 0.0202264 | 0.3434506 |
| Switzerland | 2020-03-07 | 23 | 0.0243268 | 1.5308394 |
| Trinidad And Tobago | 2020-03-22 | 8 | 0.0351261 | 0.0530476 |
| United Kingdom | 2020-03-16 | 14 | 0.0205982 | 0.2530573 |
| United States | 2020-03-19 | 11 | 0.0286114 | 0.3788462 |
| Uruguay | 2020-03-19 | 11 | 0.0228209 | 0.0878173 |
The head of the prediction model on behalf of University of Iceland’s Health Sciences Institute is Dr. Thor Aspelund. The prediction model is conducted by scientists from the University of Iceland, the Directorate of Health, and the National Hospital. Contact us: covid@hi.is

